Why Innovative Leverages DevOps

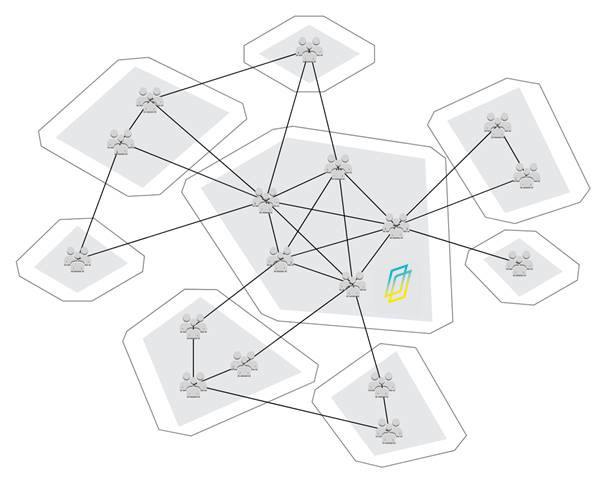
Innovative Solutions is a mid-sized company, but many times we encounter communication and coordination problems at an enterprise scale. Internally, we have multiple development teams with each team comprised of multiple team members bringing a range of skill sets. Each team interacts with third-party vendors, providers, and clients who often bring their own development teams with whom we collaborate. Quite often clients are directly communicating with third parties as well. As the number of entities in this communication graph increases, the complexity of organizing and interacting grows which requires structures and processes to be put in place to ensure efficient communication.

Over the years we have been employing and maturing our SDLC methodologies, following Agile practices, and incorporating the latest tools to help develop, deploy, and support our products and our clients. This has organically led us to leverage DevOps services driven by industry leaders including Amazon Web Services (AWS).

Innovative Solutions takes these ideas very seriously and their adoption has helped us successfully navigate an increasingly complex ecosystem. In fact, Innovative takes this so seriously we require any engagement to be working toward an end goal of leveraging DevOps processes and tools. We’ve seen time and time again when our partners understand the value in laying a proper foundation, and we all win.

Leveraging automated build and CI pipelines has taken a burden off developers freeing them to spend more time creating rather than waiting to see if tests pass. We heavily use AWS CloudFormation to automate our infrastructure setup in a repeatable manner. This makes spinning up a temporary lower environment almost instantaneously, with just one-click versus the weeks it took just a few years ago.

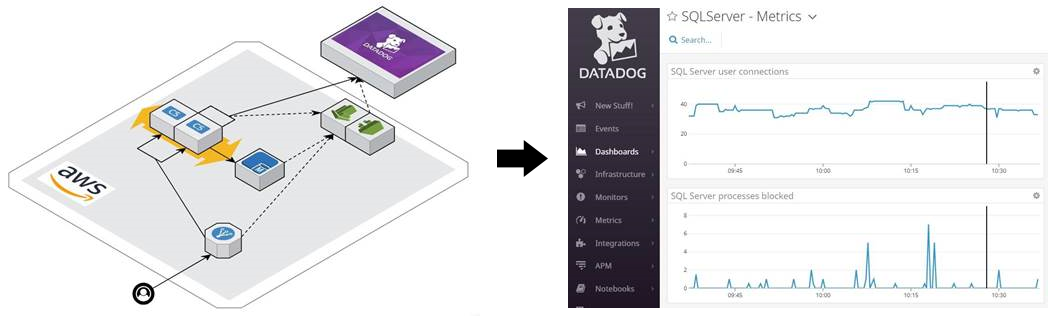
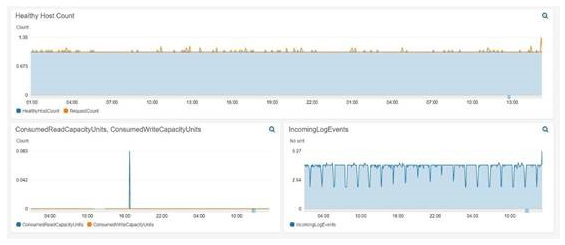
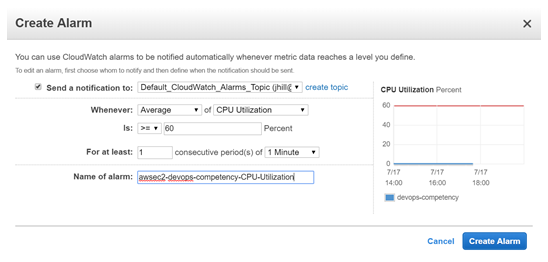
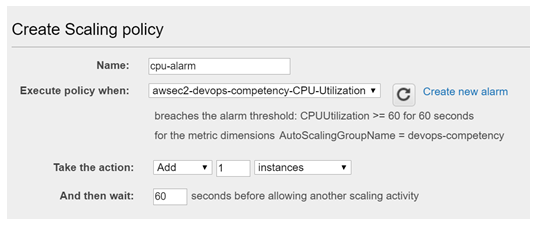
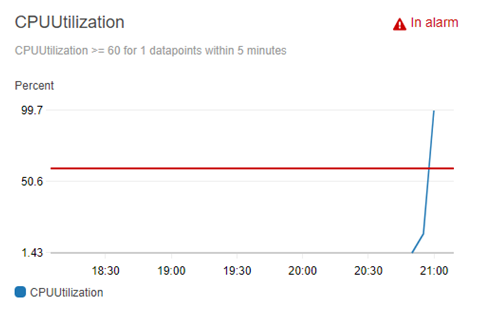
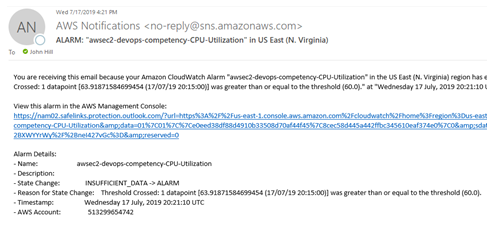
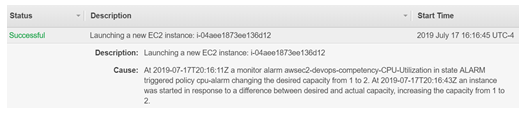
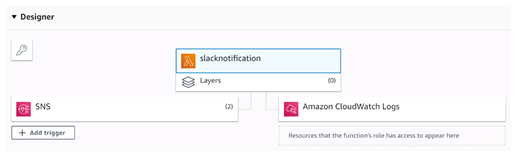
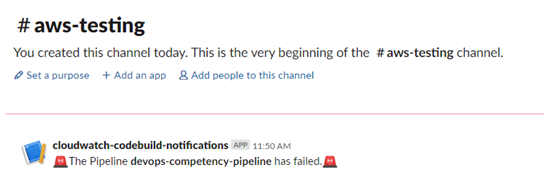
Advanced monitoring and alerting enables Innovative’s team to identify small problems before they become big ones. Tools like Amazon CloudWatch, AWS X-Ray, and Datadog provide visibility into systems unparalleled to anything we had in the past. We now leverage logs and metrics that previously were discarded to identify areas of opportunity so we can continually improve customer experience while providing tangible value to our clients.

DevOps and Regulation

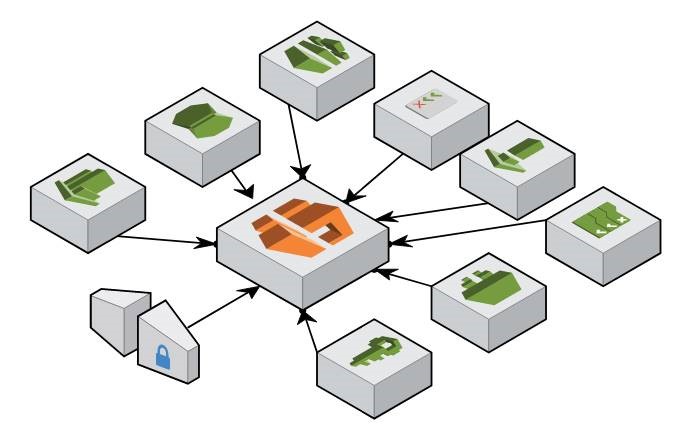
The complexities of interactions these days are exacerbated by ever-growing regulatory pressures. Innovative Solutions consistently partners with customers who must adhere to HIPAA, PCI, SOCs, and other compliances. Innovative has utilized AWS DevOps tools to create processes and controls making compliance and audits more secure and successful.

The same build and deploy pipelines that facilitate our rapid development cycles also provide immutable packages we can promote from environment to environment. This helps us ensure that no bad actors have the ability to tamper with code on its way to production.

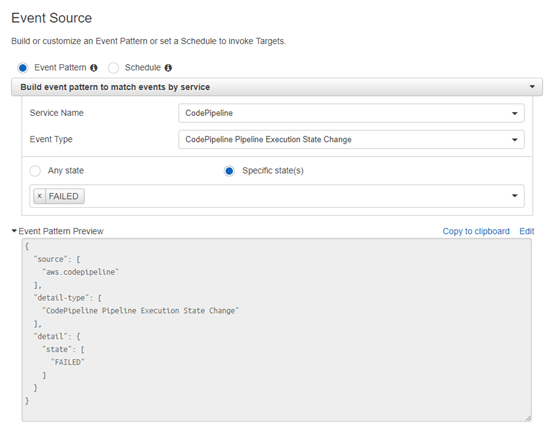
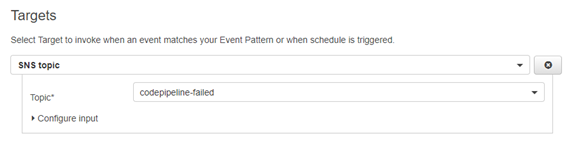
We leverage AWS CodePipeline’s manual approvals ensuring releases have the appropriate sign-off before moving forward. This allows us to put in place appropriate controls and separation of duties.

AWS Config gives us the capability to be notified when any part of our infrastructures deviates from the policies we have defined. If this happens, AWS CloudTrail makes it easy to perform root-cause-analysis and correct the problem quickly. Our applications are assessed by Amazon Inspector to identify any deviations from internal standards.


A Must-Have for Any Business

DevOps is not something off on the horizon. The methodologies and tools are mature enough that it should be considered as part of the standard SDLC. If you’re not already practicing DevOps, the time is now. DevOps is not a nice-to-have, but a must-have for any business serious about long-term software development.


Do you still have questions about DevOps?

Feel free to contact us, we’d love the opportunity to further discuss anything you have read.

Contact us for more information

Learn more about our AWS Cloud Service offering

Why Innovative uses a CI/CD pipeline

Here at Innovative Solutions we take the mantra “always be learning” to heart. It’s evident in our approach to changing the way in which we deploy our applications. A well-structured CI/CD pipeline improves many aspects of development. Over the years we’ve made massive headway in learning from our previous deployment woes and adopting a more continuous and agile approach.

Before delving into what we’ve changed I’d like to give brief explanation as to why we felt the need to make these changes; what are the pitfalls and how did they impact us?

We’ve always had to be adaptable and agile with our deployment strategies; working with many clients who utilize a variety of technologies practically mandates it. But we found ourselves repeatedly running into the same problems

Previously, one of our deployment strategies included manually combing through changes in our GIT repositories to find updated files and copying them to distribution directories. Another deployment strategy required RDPing into jump-boxes to then RDP once again into each web server and pasting the build artifacts onto each. Then, we manually went into IIS to update the directory that the hosted server pointed at.

Tasks like these were manually intensive and took time away from development. These deployment strategies were prone to error and often introduced defects into the shipped product. The effort involved meant that releases were infrequent leading to a slower time to market. These deployment processes would leave developers scratching their heads and wondering if a certain feature wasn’t working or if it hadn’t made it into the release due to an error in the manual deployment.

We knew something had to change, and fast. We began to implement new deployment strategies focused around continuous delivery and integration. Here’s how:

How does Innovative use CI/CD?

Working with many clients and a variety of technologies gives us a unique opportunity to learn which deployment strategy best suits a client and their needs. As such, we’ve been able to customize each of our CI/CD pipelines around a  client, their needs, and technology stack.

When dealing with a large application, a fully integrated build server with robust testing capabilities is required. We have an application configured to use TeamCity which performs continuous integration on artifacts that are deployed to AWS infrastructure. AWS CI/CD infrastructure allows you to painlessly integrate with third-party solutions such as Jenkins or Travis CI.

For smaller CMS sites, we leverage a cloud-native CI/CD pipeline based entirely in AWS. All the developer has to do is push their code to AWS CodeCommit. This triggers an AWS CodePipeline to orchestrate the CI/CD process. AWS CodePipeline is ideal for organizing the build and deployment flow and allows for easy step-by-step editing and visualization of the process flow.

AWS CodePipeline instructs AWS CodeBuild to both build the package and run specified tests each time a commit is pushed to our AWS CodeCommit repository. This allows for quick and continual testing and immediate notification if a build or test fails.

After all of the AWS CodeBuild tests have passed, we typically include a manual approval step in our AWS CodePipeline flow. As we work with several customers bound by regulations such as HIPAA, manual approvals help ensure that the code we’re deploying meets all process and control requirements.

AWS CodePipeline’s flexibility with manual approval steps and custom defined tests within the pipeline allow us to customize each CI/CD pipeline to specific client needs.

Some of our CMS sites are deployed to AWS Elastic Beanstalk. For these sites, ease of deployment and infrastructure management was key, and AWS Elastic Beanstalk fits those needs perfectly. AWS Elastic Beanstalk takes care to provision all of the underlying resources needed to run these sites, such as load balancing, auto scaling, and storage. Without the need to provision all these resources manually we can reduce the load on developers who can instead focus on rolling out new features instead of worrying about infrastructure.

However, there are cases where you do want more control over your deployment where AWS Elastic Beanstalk isn’t the best fit. Instead, AWS CodePipeline is flexible enough to accommodate these needs. AWS CodePipeline using AWS CodeDeploy allows you to continuously deploy code to Amazon EC2 instances that aren’t managed by AWS Elastic Beanstalk. This allows us to add CI/CD pipelines for customers who are already using Amazon EC2 instances to host their applications. Leveraging AWS CodeDeploy allows us to easily integrate their specific deployment process into a CI/CD pipeline without changing any of their underlying infrastructure.

What has Innovative learned?

While there are upfront costs, strategically focused business stakeholders can’t afford to neglect the long-term benefits of CI/CD.

According to Accelerate: State of DevOps 2018: Strategies for a New Economy, high performing teams are deploying 46x more frequently with 1/7th the error rate, when compared to low performing teams.

CI/CD pipelines save time, effort, and the mental health of developers. Here at Innovative, our team has fully embraced CI/CD and by using AWS technologies, it has made adoption that much easier.


Do you still have questions about CI/CD?

Feel free to contact us, we’d love the opportunity to further discuss anything you have read.

Contact us for more information

Learn more about our AWS Cloud Service offering

Why monitoring and logging are crucial to cloud computing success

Gone are the days that monolithic applications run on a single server on-premise. The current landscape of cloud computing and microservices has made many aspects of computing easier but monitoring and logging is not one of them. Instead of having logs on one web server, they are now often highly distributed across many different systems.

With cloud computing and containerization becoming so popular, we often have many short-lived resources that are spun up for short periods of time and then destroyed after they are done serving their purpose. This makes logging even more challenging because you need to capture and store them elsewhere before they are destroyed. Not only are the logs distributed across various systems, but there are also an increasing number of logs.

Computing systems produce logs that can be used to give insight into the current system state. Most companies store log files because “that’s what you’re supposed to do”.  However, the only time companies look at them is when a system fails, at which point they are already in panic mode trying to figure out what went wrong. Then they begin to look at the various systems logs and sort through them, trying to find the relevant ones. This becomes a nightmare when these logs are spread across multiple systems.

If you don’t have all your logs in a centralized place where you can efficiently sort and filter through them, you won’t be able to quickly troubleshoot problems. The information exists but because there is no easy way to decipher it; you’re essentially looking into a black box.

Innovative Solutions legacy process for monitoring and logging

In order to see logs that the web servers and databases were producing, we had to log into web servers and databases. This was very time-consuming and inefficient. We didn’t have a simple way to monitor our applications. We were reactive to issues reported by customers, rather than having a proactive approach to identify and act on issues before they happened.

Current use of monitoring and logging leveraging AWS

One logging and monitoring pattern that we leverage today is to aggregate Iog files and metrics in third-party cloud-native monitoring platforms such as Datadog. Logs are collected in Amazon CloudWatch and then pulled into Datadog via the Datadog AWS integration. Agents running on compute instances also push logs into Datadog. This allows us to monitor and analyze our production environment in near real-time.

Purposeful Logging

The goal for a logging system is not to collect logs like trading cards; it’s to use them to carry out automated actions and achieve high system visibility. Amazon CloudWatch provides log storage in a centralized location, so you don’t need to go searching across various systems. However, just storing logs in a centralized location isn’t enough. Amazon CloudWatch provides services that allow you to monitor your systems and take action based on events and alarms. Amazon CloudWatch events and alarms integrate with many other AWS services such as Auto Scaling Groups, Amazon SNS, Amazon SQS, AWS CodePipeline, AWS Lambda, and many more.

Monitoring in Amazon CloudWatch

With Amazon CloudWatch you can track system metrics for your instances (e.g. CPU utilization) and have them display on a dashboard. This allows you to see the health of your application without needing to dig through thousands of log files. We can check our dashboards to make sure the operation of our systems is nominal. You can see an example dashboard below that shows the healthy host count, consumed RCUs and WCUs, and incoming log events. A simple dashboard like this can give you a quick idea of how your systems are performing with minimal effort.

Amazon CloudWatch Alarms

Amazon CloudWatch alarms enable us to scale up and down based on thresholds for metrics identified as application bottlenecks. In this example, I created an Amazon CloudWatch alarm that watches the average CPU Utilization metric for all the instances in an Auto Scaling Group. If the average CPU Utilization goes above 60%, an alarm will be triggered which will: send a message to an SNS topic and add an instance to the Auto Scaling Group.

This shows the creation of the Amazon CloudWatch alarm which sends a notification to the ‘Default_CloudWatch_Alarms_Topic’ SNS topic.

Then we added the auto scaling action so that our Auto Scaling Group adds one instance when the alarm (awsec2-devops-competency-CPU-Utilization) is triggered.

You can see the graph of the CPUUtilization with the red horizontal line representing the 60% CPUUtilization alarm. The blue line represents the CPUUtilization of the Amazon EC2 instances in the auto scaling group. When the alarm threshold is met the alarm is triggered and subsequent actions are run. In order to test triggering the alarm I logged into the Amazon EC2 instance and created and ran a Python script that simulates high CPU load.

As you can see below for this CloudWatch alarm, we have set up two actions: a message to an Amazon SNS topic “Default_CloudWatch_Alarms_Topic”, and an auto scaling action that will add one instance to the Auto Scaling Group that we have specified ‘devops-competency.’

After the alarm was triggered, the message was sent to the SNS topic which then sent an email to the subscribers of that topic. I set my email as a subscriber to the topic and received the following email:

Having the appropriate people notified of an alarm being triggered is nice, but you also want to pair that with an appropriate action automatically triggered such as scaling up your Auto Scaling Group. As seen in notification below, after the alarm was triggered the capacity of the Auto Scaling Group was increased from one to two instances.

CloudWatch Events

Amazon CloudWatch provides many types of events. Some examples would be events created upon state transition in AWS CodePipeline.

When you create a pipeline via AWS CodePipeline you are given the option to use Amazon CloudWatch Events as a change detection option in the source stage. This means that when I push my code to the source repository, the pipeline automatically starts and runs through all the subsequent stages.

You can also configure Amazon CloudWatch events to watch your AWS CodePipeline and receive notifications based on state changes. I created a CloudWatch event rule that would detect when the AWS CodePipeline Execution State changed to a FAILED state.

After you specify an event source, you can then specify the target of what you want to happen after a rule is matched. In this case I set an Amazon SNS topic (called ‘codepipeline-failed’) as the target:

Then I created an AWS Lambda function that would send a notification to a specified Slack channel, saying that an AWS CodePipeline stage has failed. The members of the Slack channel will see this and can take the appropriate actions to figure out what went wrong.

I also set the AWS Lambda function as a subscriber to the Amazon SNS topic so that when a message is sent to the Amazon SNS topic the AWS Lambda function will be automatically triggered.

You can see the corresponding message in the Slack channel below:

By using Amazon CloudWatch events, we now have a better integrated CI/CD pipeline. If a developer pushes code to our AWS CodeCommit repository and any stage of the AWS CodePipeline fails, our team will be automatically notified in our Slack channel.

Do you still have questions about monitoring and logging?

Feel free to contact us, we’d love the opportunity to further discuss anything you have read.

Contact us for more information

Learn more about our AWS Cloud Service offering

Download

  • This field is for validation purposes and should be left unchanged.