Gone are the days that monolithic applications run on a single server on-premise. The current landscape of cloud computing and microservices has made many aspects of computing easier but monitoring and logging is not one of them. Instead of having logs on one web server, they are now often highly distributed across many different systems.
With cloud computing and containerization becoming so popular, we often have many short-lived resources that are spun up for short periods of time and then destroyed after they are done serving their purpose. This makes logging even more challenging because you need to capture and store them elsewhere before they are destroyed. Not only are the logs distributed across various systems, but there are also an increasing number of logs.
Computing systems produce logs that can be used to give insight into the current system state. Most companies store log files because “that’s what you’re supposed to do”. However, the only time companies look at them is when a system fails, at which point they are already in panic mode trying to figure out what went wrong. Then they begin to look at the various systems logs and sort through them, trying to find the relevant ones. This becomes a nightmare when these logs are spread across multiple systems.
If you don’t have all your logs in a centralized place where you can efficiently sort and filter through them, you won’t be able to quickly troubleshoot problems. The information exists but because there is no easy way to decipher it; you’re essentially looking into a black box.
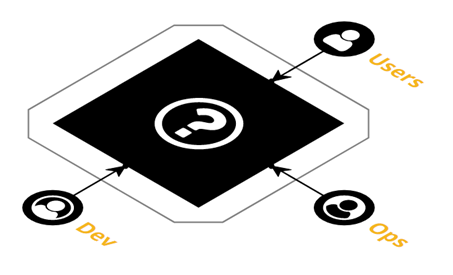
Innovative Solutions legacy process for monitoring and logging
In order to see logs that the web servers and databases were producing, we had to log into web servers and databases. This was very time-consuming and inefficient. We didn’t have a simple way to monitor our applications. We were reactive to issues reported by customers, rather than having a proactive approach to identify and act on issues before they happened.
Current use of monitoring and logging leveraging AWS
One logging and monitoring pattern that we leverage today is to aggregate Iog files and metrics in third-party cloud-native monitoring platforms such as Datadog. Logs are collected in Amazon CloudWatch and then pulled into Datadog via the Datadog AWS integration. Agents running on compute instances also push logs into Datadog. This allows us to monitor and analyze our production environment in near real-time.

Purposeful Logging
The goal for a logging system is not to collect logs like trading cards; it’s to use them to carry out automated actions and achieve high system visibility. Amazon CloudWatch provides log storage in a centralized location, so you don’t need to go searching across various systems. However, just storing logs in a centralized location isn’t enough. Amazon CloudWatch provides services that allow you to monitor your systems and take action based on events and alarms. Amazon CloudWatch events and alarms integrate with many other AWS services such as Auto Scaling Groups, Amazon SNS, Amazon SQS, AWS CodePipeline, AWS Lambda, and many more.
Monitoring in Amazon CloudWatch
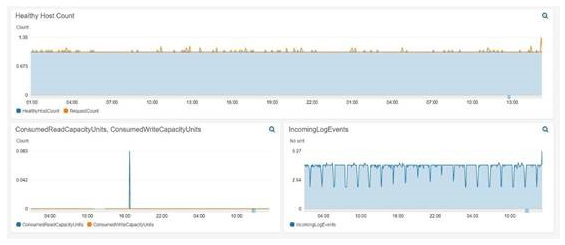
With Amazon CloudWatch you can track system metrics for your instances (e.g. CPU utilization) and have them display on a dashboard. This allows you to see the health of your application without needing to dig through thousands of log files. We can check our dashboards to make sure the operation of our systems is nominal. You can see an example dashboard below that shows the healthy host count, consumed RCUs and WCUs, and incoming log events. A simple dashboard like this can give you a quick idea of how your systems are performing with minimal effort.
Amazon CloudWatch Alarms
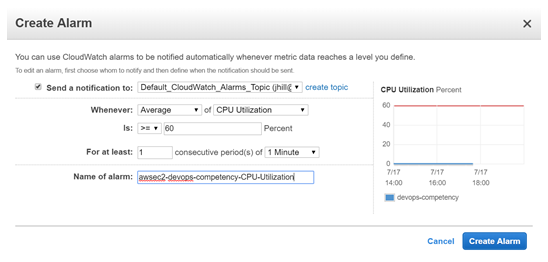
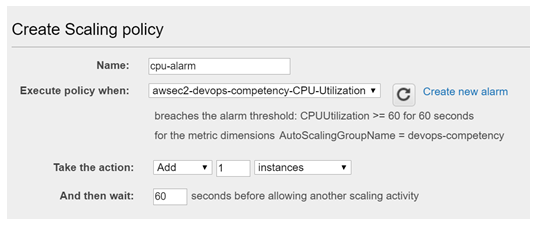
Amazon CloudWatch alarms enable us to scale up and down based on thresholds for metrics identified as application bottlenecks. In this example, I created an Amazon CloudWatch alarm that watches the average CPU Utilization metric for all the instances in an Auto Scaling Group. If the average CPU Utilization goes above 60%, an alarm will be triggered which will: send a message to an SNS topic and add an instance to the Auto Scaling Group.
This shows the creation of the Amazon CloudWatch alarm which sends a notification to the ‘Default_CloudWatch_Alarms_Topic’ SNS topic.
Then we added the auto scaling action so that our Auto Scaling Group adds one instance when the alarm (awsec2-devops-competency-CPU-Utilization) is triggered.
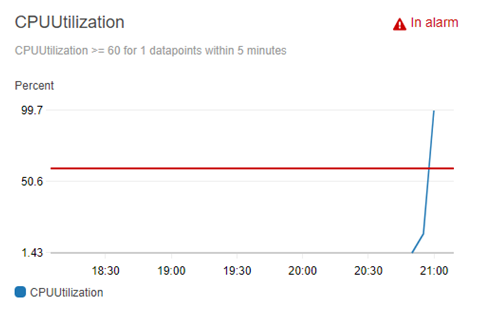
You can see the graph of the CPUUtilization with the red horizontal line representing the 60% CPUUtilization alarm. The blue line represents the CPUUtilization of the Amazon EC2 instances in the auto scaling group. When the alarm threshold is met the alarm is triggered and subsequent actions are run. In order to test triggering the alarm I logged into the Amazon EC2 instance and created and ran a Python script that simulates high CPU load.
As you can see below for this CloudWatch alarm, we have set up two actions: a message to an Amazon SNS topic “Default_CloudWatch_Alarms_Topic”, and an auto scaling action that will add one instance to the Auto Scaling Group that we have specified ‘devops-competency.’

After the alarm was triggered, the message was sent to the SNS topic which then sent an email to the subscribers of that topic. I set my email as a subscriber to the topic and received the following email:
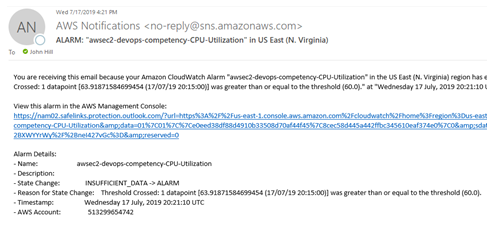
Having the appropriate people notified of an alarm being triggered is nice, but you also want to pair that with an appropriate action automatically triggered such as scaling up your Auto Scaling Group. As seen in notification below, after the alarm was triggered the capacity of the Auto Scaling Group was increased from one to two instances.

CloudWatch Events
Amazon CloudWatch provides many types of events. Some examples would be events created upon state transition in AWS CodePipeline.
When you create a pipeline via AWS CodePipeline you are given the option to use Amazon CloudWatch Events as a change detection option in the source stage. This means that when I push my code to the source repository, the pipeline automatically starts and runs through all the subsequent stages.
You can also configure Amazon CloudWatch events to watch your AWS CodePipeline and receive notifications based on state changes. I created a CloudWatch event rule that would detect when the AWS CodePipeline Execution State changed to a FAILED state.
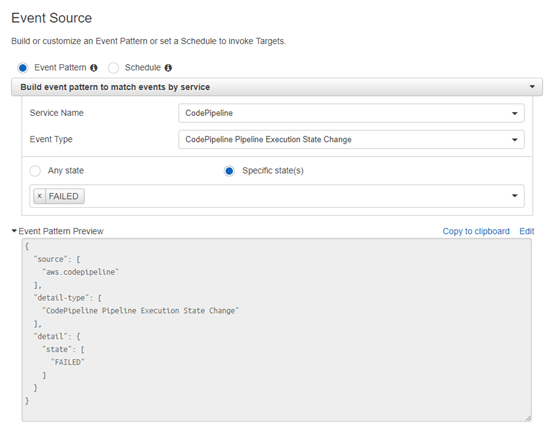
After you specify an event source, you can then specify the target of what you want to happen after a rule is matched. In this case I set an Amazon SNS topic (called ‘codepipeline-failed’) as the target:

Then I created an AWS Lambda function that would send a notification to a specified Slack channel, saying that an AWS CodePipeline stage has failed. The members of the Slack channel will see this and can take the appropriate actions to figure out what went wrong.
I also set the AWS Lambda function as a subscriber to the Amazon SNS topic so that when a message is sent to the Amazon SNS topic the AWS Lambda function will be automatically triggered.

You can see the corresponding message in the Slack channel below:
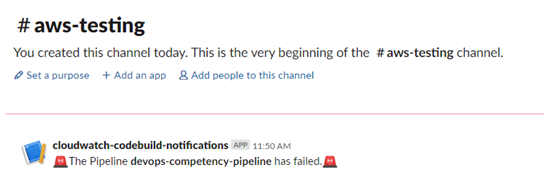
By using Amazon CloudWatch events, we now have a better integrated CI/CD pipeline. If a developer pushes code to our AWS CodeCommit repository and any stage of the AWS CodePipeline fails, our team will be automatically notified in our Slack channel.
Do you still have questions about monitoring and logging?
Feel free to contact us, we’d love the opportunity to further discuss anything you have read.


